
Previous article
Back
What is object-centric process mining?

Object-centric process mining (OCPM) is a novel approach to process mining and execution management that overcomes the limitations of traditional techniques and allows organizations to better visualize and analyze the complexity and interconnectedness of modern business operations.
Celonis was the first technology provider to fully embrace object-centric process mining with the release of Process Sphere™, a new capability of the Celonis platform unveiled at Celosphere 2022.
According to prof. Wil van der Aalst, the Godfather of Process Mining and Chief Scientist at Celonis, OCPM represents a step-change in the field of process mining. And with the launch of Process Sphere, Celonis has leveraged OCPM to reinvent process mining by moving from static, two-dimensional views of processes and organizations to a dynamic, three-dimensional view.
To fully understand the significant improvement OCPM provides over traditional process mining, it’s worth discussing process mining and its limitations.
TLDR: If you’re already a process mining expert, feel free to skip past the "What is process mining?" and "What are the limitations of traditional process mining?" sections. Go straight to "What is object-centric process mining (OCPM)?" below.
Download the free Object-Centric Process Mining white paperWhat is process mining?
Process mining is an analytical discipline that combines data science and process science to model, analyze and optimize processes within businesses, public agencies or other organizations.
A classical process mining approach begins by extracting event data from the information systems that run modern business operations, such as enterprise resource planning (ERP), customer relationship management (CRM) and supply chain management (SCM) applications. These systems often contain different parts, are supplied by multiple vendors, and store data in dozens, hundreds or even thousands of tables.
Once extracted, the event data are used to discover how your processes actually function. With full transparency into how work flows through your organization, you can use conformance checking to identify where and when common problems occur and where opportunities may be hiding. You can then continuously monitor your processes to detect any deviations or new opportunities. With enough data and stable processes, you can even predict when problems will likely happen.
Whether you're able to make predictions or not, process mining can be paired with automation to trigger corrective action within your actual processes and improve operational efficiency.
As noted above, process mining begins with event data extraction. These data are stored in event logs like the one shown below.
Each process instance is called a case and can consist of multiple events related to the process. Each case can be viewed as a sequence of events. An event log can be considered a collection of cases and a case can be seen as a sequence of events.

Traditional process mining data table for a sales order process.
In the table shown above, each row corresponds to a specific event within the sales order business process. An event can be defined by multiple attributes, but for process mining you need at least three; a case (identified by a Case ID), an activity (text description of the event), and a timestamp (when the event occurred). Other information such as the name of the product, price, quantity, etc. may be included but are not required.
Multiple rows with the same Case ID identify the individual events within the process for that particular case. For example, Case ID 6204 has an individual row with the “prepare delivery” Activity attribute and a row with the “make delivery” Activity attribute.
Event logs in hand, you can apply process mining capabilities, such as those built on the Celonis Process Intelligence Graph, to the data to discover the paths your processes take. The so-called happy path contains the most frequent starting activity and the most frequent ending activity as well as other activities that connect them.

Process mining tools show you how work flows through the organization.
As you look at paths that occur less frequently, you’ll begin to see the various choices and loops within the process. And when you look at all the paths a process can take within your organization, you typically see a spaghetti model, which shows that in reality your processes are much more complicated than the idealized view people likely have of them.
Within the deviations uncovered during process discovery are the opportunities for process improvement.
What are the limitations of traditional process mining?
Although extremely powerful, according to prof. van der Aalst, traditional process mining techniques have the following limitations:
Data extraction and transformation is painful and needs to be repeated.
Interactions between objects are not captured.
3D reality is squeezed into 2D event logs and models.
To understand each of these limitations, it’s first necessary to understand how modern processes work and how the data associated with them is stored.
A classic process model assumes a single case notion, the assumption that a single case (or process instance) happens in isolation. In event logs, like the one above, this single case notion is illustrated by the fact that one case identifier (Case ID) exists per event.
This is not how events happen in the real world nor is it how data is often stored in the information systems from which event log data is pulled. For example, the sales department may track their processes through digital documents like sales orders. When you apply traditional process mining tools to the sales order business process, you would look at a single object, the sales order and examine how it flows through the sales department. With this information you could identify areas for process improvement and implement process changes to close those execution gaps.
However, the sales department doesn’t operate in a vacuum. Events that occur during the sales process affect other departments, such as procurement, production, warehouse, distribution, finance and so on. Furthermore, different departments use different objects in their processes. Production could use production orders, finance could use invoices, procurement could use purchase orders and so on. All these objects are connected because the processes are connected.
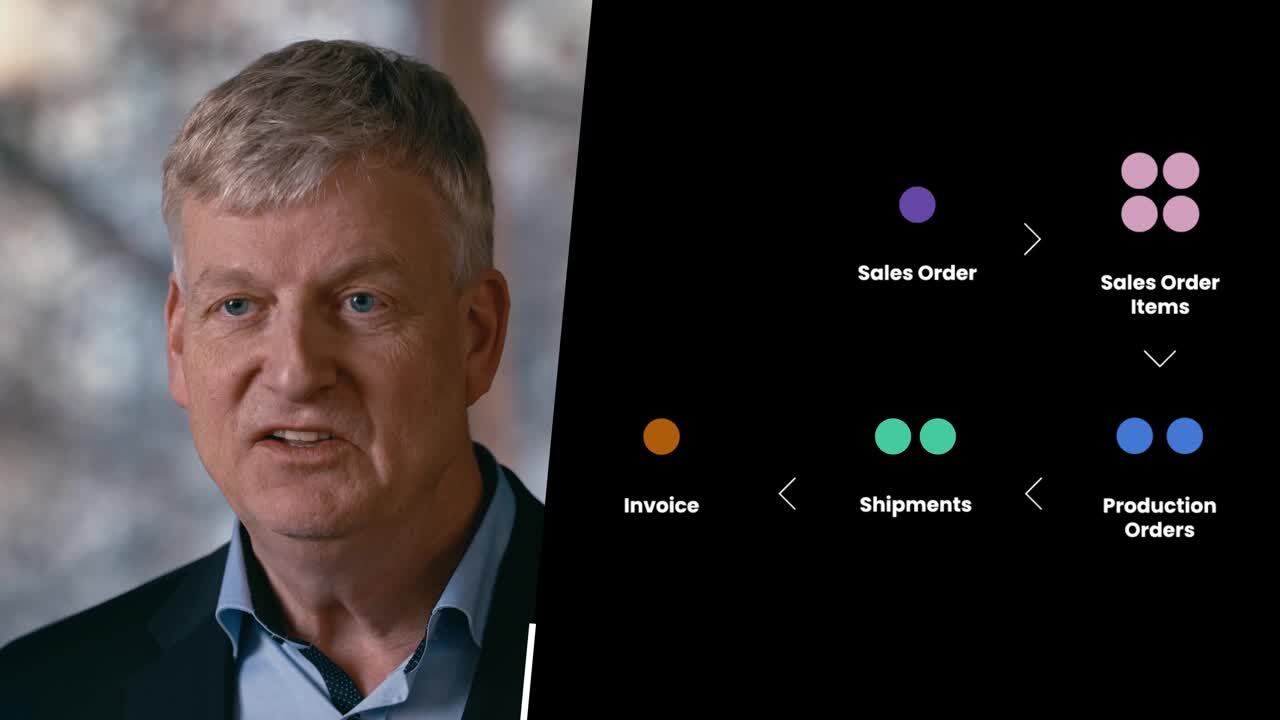
Consider a customer who places an order for four items at the same time. One item is in stock and the other three need to be manufactured. For the items that need to be manufactured, three production orders are created. The in-stock item is packaged and shipped on its own, while the remaining items are packaged together and shipped later once they have been produced. The customer is then sent a single invoice.

Processes usually involve multiple objects (eg. sales order, sales order items, production orders, shipments and invoices) that are all related to each other.
This example illustrates how a single event, the creation of a sales order, can involve multiple objects (customers, sales orders, sales order items, production orders, shipments and invoices) that are all related to each other. For example, a customer can have multiple sales orders (one-to-many relationship). Likewise, a sales order can contain multiple sales order items and a sales order item can be included on multiple sales orders (many-to-many relationship). To handle these relationships, ERP, CRM, SCM and other business systems often store information in what’s known as a relational database.
In a relational model, data is organized into tables of rows and columns. Rows are called records, columns are called attributes and tables are relations. For example, in a customer table, each row could correspond to an individual customer record and each column would be an attribute such as name, address, phone number and the like. Thinking about our sales order example above, a sales order table could have a row/record for each order and columns/attributes for information such as the order number, date and time, customer, items ordered, price for each item, billing address, shipping address, shipment method and so on.
Each row within a table of a relational database has a unique identifier called a key. For example, on a customer table, each customer would be assigned a distinct customer ID that would be used as the table’s primary key (PK). On the sales order table, the primary key could be a sales order ID. Each time a new record is written to a table, a new primary key value is generated for that record.
Primary keys are how the system accesses information on an individual table and are also used to show the relationships between tables. For example, rows in the customer table can be linked to rows in the sales order table by adding a customer ID column to the sales order table. Each time a customer makes a new purchase, a record is added to the sales order table, and the customer’s unique customer ID is added as an attribute called a foreign key (a unique key from a linked row on another table). This model works well for one-to-many relationships, where many rows in one table have a column value that equals the primary key on another table.
To account for many-to-many relationships, the primary keys from related tables are often copied to an additional table that is used to resolve the relationship between the two entity tables. Consider for example, the many-to-many relationship between sales orders and sales order items outlined above. Here you could have a sales order table, a sales order item table and a third resolution table. The resolution table would contain at the very least a column for each of the foreign keys from the sales order and sales order item tables (primary keys on those tables) as well as a new primary key created from the two foreign keys.
In our simple sales orders and sales order items example, there are at least three tables needed to define the relationship. In the real world, it takes a lot more. Think back to the sales order process outlined above. A single sales order is related to four sales order items, three production orders, two shipments and one invoice. Each of these objects is related to other objects, such as customers, suppliers, shippers and so on. Therefore, it shouldn’t be hard to see why modern business information systems, such as an ERP system, use databases with hundreds, thousands and even hundreds of thousands of tables.
We can now consider the three limitations of traditional process mining noted earlier:
Data extraction and transformation is painful and needs to be repeated. Classic process mining requires you to pull data from the multi-table, relational databases of the source information system(s) into a flat event log (i.e., table) where each event (i.e., row) refers to a case, an activity and a timestamp. In our sales order example for instance, each case would be a specific sales order, and we could ask a question like, What’s the most common reason for a blocked order? However, if we wanted to ask a question such as, Which customers are paying their invoices on time? we would need a different event log with invoices, not sales orders, as the case notion. Thus, we would need to go back to the data and make a new extraction, which can be a time consuming and painful process.
Interactions between objects are not captured. When you extract data from a relational database and flatten it into a process mining event log where each event is a single case, you lose the interactions between objects defined in the source data. Likewise, any process models you generate from the flattened data only describe the lifecycle of a case in isolation. To get complete process transparency, you must understand the relationship between all the different objects and objects types involved in the process.
Three-dimensional reality is squeezed into two-dimensional event logs and models. In traditional process mining, an event log is created for each object type and analyzed separately. For example, we create an event log for sales orders to examine the sales order process, an event log for customer invoices to look at the accounts receivable process, a log for vendor invoices to analyze accounts payable and an event log for purchase orders for the procurement process. Even if these flat event logs are linked through a related cases data model, we’re still squeezing three-dimensional, object-centric data and models into two-dimensional, case-centric event logs and process models.
This data flattening leads to the problems of convergence and divergence.
Convergence happens when one event is replicated across different cases, possibly leading to unintentional duplication. Consider the sales order process example outlined above, if we select a sales order item as a case notion, events at the sales order level (e.g., place order) would be duplicated for every sales order item related to a specific sales order. This replication of events can cause misleading diagnostics.
Divergence happens when there may be multiple instances of the same activity within a single case. Using our sales order process example from above, if we select sales order as a case notion, events at the sales order item level (e.g., pick item) may become indistinguishable and seemingly related. For example, the pick item and pack item events happen only once per item and in a fixed sequence (e.g., you pick the item then pack it), within a flattened sales order event log, these events may appear to happen many times and in a seemingly random order for an individual case.
What is object-centric process mining (OCPM)?
In 2021, prof. van der Aalst wrote that “process mining technology needs to move closer to the true fabric of processes and systems.” Object centric process mining is designed to further this transformation by creating process models that more accurately reflect the object-centric nature of end-to-end business processes.
Object-centric process mining addresses the limitations of traditional process mining and convergence and divergence problems by not defining events as being related to a single case. OCPM uses an object-centric event log (OCEL) that allows an event to be related to multiple objects (e.g., sales orders, sales order items, production orders and the like). Instead of using case centric event data like traditional process mining, OCPM uses object centric event data.
A simple way to describe an OCEL is with two tables, one for events and one for objects. On the events table, each event (i.e. row on the events table) has an identifier, an activity, a timestamp, related objects and possibly other event attributes. On the objects table, each row defines an object and contains an identifier, type (e.g., sales order item, customer and so forth) and possibly other descriptive attributes (e.g. size, weight, address, and the like).
Unlike a traditional process mining event log, an object centric event log captures the one-to-many and many-to-many relationships between multiple objects.
Object-centric process mining allows us to view a process from any angle. We move from a two-dimensional view, where we look at a single object type, to a three-dimensional view where we consider multiple object types at the same time and how they are interrelated.
What are the benefits of object-centric process mining?
Object-centric process mining addresses the limitations of and offers multiple advantages over traditional process mining, including:
Data extraction is only done once, which allows you to choose the view, the objects, and the activities you want to analyze.
Interactions between objects are captured in object-centric event logs.
It produces three-dimensional event logs and process models that better represent the reality of modern business operations and allows for greater business process insights.
For more information on OCPM, download the white paper below.
Object-Centric Process Mining: The next frontier in business performance
What is Celonis Process Sphere?
Process Sphere™ is a new capability of the Celonis platform that enables object-centric process mining. Introduced at Celosphere 2022, Process Sphere is designed to give business decision makers a more complete picture of their end-to-end processes.
“Celonis Process Sphere represents the biggest step-change in the field for 10 years and establishes new table stakes for process mining and how companies operate,” said Professor Wil van der Aalst, in a press release about the announcement. “We can now reliably capture all the complex relationships and interdependencies that exist in modern business and provide a full picture of how processes are connected,” he added.
With Process Sphere, Celonis users can visualize and analyze the complex relationships between objects and events across interconnected processes. For example, with Process Sphere you can see if product problems are affecting sales order fulfillment.

Celonis Process Sphere™ is a new capability of Celonis that’s built on object-centric process mining.
Process Sphere provides a deeper, more accurate and three-dimensional view of end-to-end business processes. A simplified 'subway map' view offers a richer and simpler expression of the business based on innovative semantic language. Embedded process analytics deliver a shorter time-to-insight with new analytical components embedded into the view.
“Process Sphere is the beginning of a new journey for Celonis,” said Celonis Co-founder and CTO Martin Klenk in a company press release. “We are moving to a universe where process data is not interpreted as lines in a table, but as the real-world objects that people work with, and how they relate. This opens up massive opportunities for our customers to interact and build with their data in their own language, in a way they are already intimately familiar with.”
Going from traditional process mining to object-centric process mining with Celonis Process Sphere is like going from an X-ray to an MRI. X-rays are a useful tool for revealing hidden problems inside the body, but they only provide a two-dimensional view. An MRI gives you a three-dimensional view and a more comprehensive perspective. Process Sphere is like an MRI for your business.
Object-centric process mining infographic
The following object-centric process mining infographic illustrates how OCPM and Celonis Process Sphere can be used to build a resilient and sustainable supply chain.


More blog posts on Process in Practice
